Facebook and YouTube Continue to Rule U.S. Social
 Adshine.pro11/24/20259 views
Pew Research has rolled out its newest examination of American social media behavior, surveying 5,000 people to map out which platforms they actually open, rather than how long they stay there.
It’s a useful snapshot, though admittedly incomplete. Time spent inside an app would paint a far richer—and arguably more important—picture, but that metric is notoriously hard to gather with precision. So, consider this more of a directional reading of platform usage than a definitive ranking of relevance or cultural dominance.
Take from it what you choose.
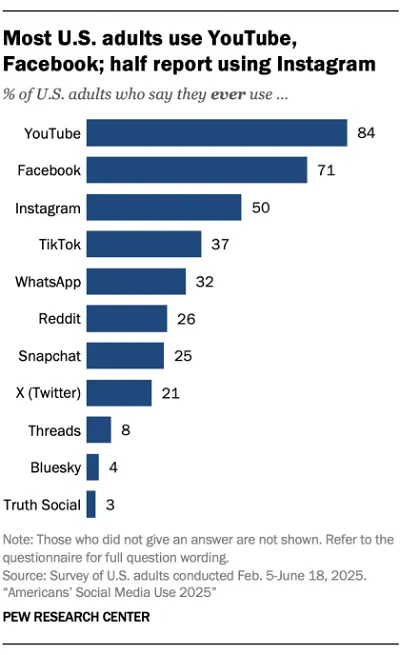
To begin, let’s look at overall reach. According to Pew, YouTube and Facebook remain firmly in front, with 71% of respondents saying they “ever use” Facebook.
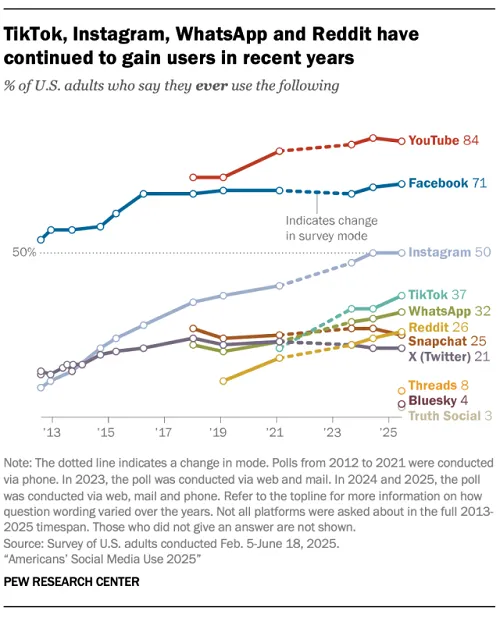
In this chart, YouTube, Facebook, and Instagram continue to command the broadest audiences, while TikTok, WhatsApp, and Reddit are steadily gaining traction among U.S. users.
But the framing matters. Respondents weren’t asked which app they prefer or rely on most—only whether they use it at all. And that nuance especially matters for Facebook, which may show up as the most widely used app, yet likely sees fewer hours of attention compared to TikTok or Instagram. Many Americans still drop into Facebook out of habit, but increasingly invest their scrolling time elsewhere.
We don’t have concrete comparisons on this front, though Pew does attempt to get closer to popularity by looking at daily visitation.
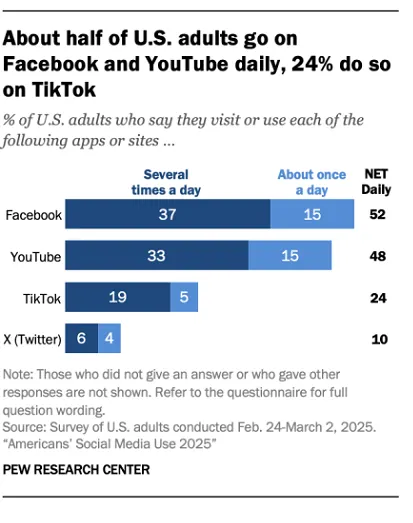
Still, even here the survey focuses on frequency—“how often do you visit?”—not duration.
Facebook has become an everyday ritual for checking family updates, local chatter, birthdays, and life milestones. So yes, daily usage feels predictable, especially as Meta continues stuffing more Reels into feeds to boost stickiness.
But again, we lack the one metric advertisers, creators, and analysts crave most: total time spent. Without it, we’re only seeing part of the competitive landscape.
One notable addition in this year’s report, however, is Threads—its first appearance in the Pew dataset.
This chart suggests that around 8% of respondents now use Threads, compared to 4% on Bluesky and 21% still active on X.
Threads has been gaining momentum since launch, while X appears to have lost some appeal following various platform shifts. Yet despite narrative headlines about declining usage, X still maintains a meaningful foothold among U.S. users—at least according to this survey. Threads isn’t overtaking it yet, but the trajectory is clear.
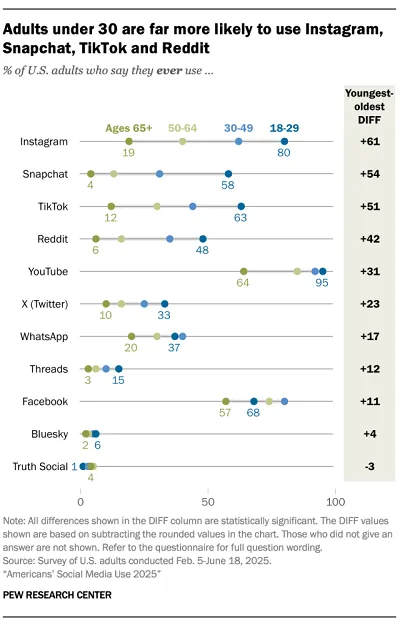
Naturally, these findings shift drastically depending on demographic filters—5,000 respondents represent only a sliver of the American population. But directionally, the data illustrates which apps still maintain cultural presence, or at minimum, occasional utility.
Younger audiences, unsurprisingly, paint a different picture, favoring Instagram, Snapchat, and TikTok.
The report goes deeper, exploring breakdowns by gender, political affiliation, ethnicity, and more, offering richer nuance for those who want to dig in.
Overall, it’s a compelling read on platform awareness and adoption. But without measuring attention, engagement intensity, or time spent, it shouldn’t be treated as a scoreboard of true popularity.
Usage isn’t influence. Opening an app is not the same as living in it—and increasingly, that distinction defines the modern social media hierarchy.
📢 If you're interested in Facebook Ads Account, don't hesitate to connect with us!
🔹 https://linktr.ee/Adshinepro
💬 We're always ready to assist you!

